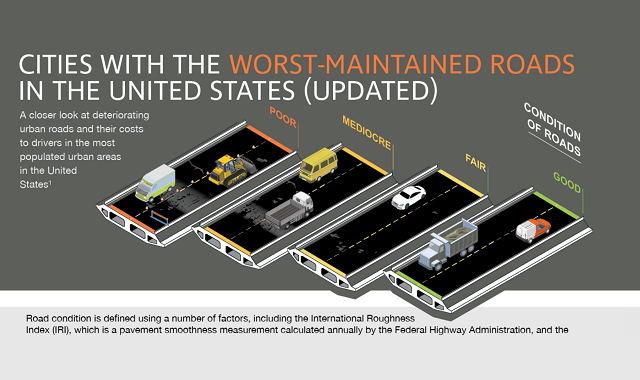
Numerous cities across the United States have gained notoriety for their poorly maintained roads, plagued by issues such as large potholes and infrastructure deficiencies. Such road conditions not only pose dangers and frustrations for drivers but also result in expensive vehicle repairs. So, which cities in the United States have the most notorious roads? Teletrac Navman's infographic examines the state of roads in major urban areas throughout the country, determining the cities with the worst road conditions in the United States.
As you drive over what seems like the fifth pothole in just as many minutes, you can’t help but to wonder where all that money for the roads is going to.
Well, wonder no more with this chart that breaks down the annual costs for the highways systems in each state. Using color coded bars that show just how much the states are investing into each of their state-controlled miles, we can see how much goes to a variety of costs: administrative, maintenance, capital and bridge, and highway law enforcement and safety, interest, and bond retirement costs per mile. When you multiply these costs by the number of miles each state controls, supplied within the middle of the chart, you will be amazed at the massive amounts of money that the highways systems cost the states each year. One of the smallest states, New Jersey, had the biggest cost per mile which more than doubled Florida in second place with $241,100 per mile.
Caring for your car is only natural. It is your ride or die
and people often get very possessive about their vehicles. As a car person
myself, I know the stress and hassle that goes on the maintenance of the car. Cars
require regular maintenance for it to run smoothly. Engine oil is its food and
you need to keep it really stuffed with it.
So far, the epidemic of COVID-19 has managed to disrupt the entire system of the world, and according to the recent reports, a great deal of time is required to restore these conditions. The effect of coronavirus has not only caused the entire communities to undergo complete isolation, but it has also adversely affected the market and its future. Similarly, the isolation has caused a global setback for the Auto Parts market.
Google Maps published a a blogpost on Thursday on traffic and routing to explain to people how it identifies a massive traffic jam or determines the best route for a trip.
While Maps can easily identify traffic conditions using the aggregate location data, the data still is not sufficient to predict what traffic will look like 10, 20, or 50 minutes into a user's journey. According to Google Maps, that's where technology really comes into play. To make such predictions, Maps analyzes historical traffic patterns for roads over time. The combined database of historical traffic patterns with live traffic conditions using machine learning helps generate predictions.
Google Maps revealed that it recently partnered with DeepMind, an Alphabet AI research lab, to improve the accuracy of its traffic prediction capabilities. Maps also states that its predictions have been ''consistently accurate for over 97% of trips.''. By working with DeepMind, Maps has been able to cut the inaccuracy percentage even more and for that, it has used Graph Neural Networks, a machine learning architecture. The technology has helped make significant improvements in places like Berlin, Jakarta, São Paulo, Sydney, Tokyo, and Washington D.C.
Moreover, with the recent significant changes in traffic patterns around the world that the Coronavirus pandemic has brought, Google Maps has had to update its models to become more agile.
The first most successful thing that ever came into existence was a wheel. With the passage of time, the importance of transportation has increased and become more relevant to the economic and social development of any state. If we take the example of the U.S, it has the most extensive infrastructure for the development of its roads, and this is also the same reason why it is the highest-grossing country of all time.
Whether you’re a current resident of Australia, or you’re planning your dream trip Down Under, it’s good to know the current traffic situation. If you’re concerned with personal safety, you should be aware of the traffic fatality statistics in your area. For world travelers, this guide from TeletracNavman.com.au provides a detailed look at car crash fatality statistics Australia, which are broken down by time by state/territory, time of day, week, and month. The data stretches back to 2011, so readers will get a very complete look. For example, this data from Australian GPS Fleet Management company, Teletrac Navman suggests that the most extreme accidents happen on Saturdays, in the late afternoon. Travelers should avoid being on the road at these times. Additionally, Autumn is the worst season for accidents in about half of the country. No matter which part of Australia you live in or are exploring, this guide is for you. Make traffic safety an integral part of your overall travel experience!


