In recent years, artificial intelligence (AI) has grown in popularity within recent years. A majority of this fame comes from how widely applicable and useful it can be. However, the utility of AI has hidden costs associated with it. The amount of power used in every AI search query is between 23 and 30 times higher than a normal internet search. For perspective, if every regular search was replaced with an AI query, the annual power consumption would be equal to the yearly power consumption of Ireland – at around 29.3 Terawatt Hours. With the increasing popularity of AI, these servers are expected to consume 85.4 Terawatt Hours of electricity annually.
In recent years, artificial intelligence (AI) has grown in popularity within recent years. A majority of this fame comes from how widely applicable and useful it can be. However, the utility of AI has hidden costs associated with it. The amount of power used in every AI search query is between 23 and 30 times higher than a normal internet search. For perspective, if every regular search was replaced with an AI query, the annual power consumption would be equal to the yearly power consumption of Ireland – at around 29.3 Terawatt Hours. With the increasing popularity of AI, these servers are expected to consume 85.4 Terawatt Hours of electricity annually.
Ooma’s five-year power outage analysis shows that power outage length and frequency depend on each state’s power grid stability and emergency response capabilities. Delaware is the peak of power grid efficiency, with the shortest average outage duration of 101 minutes. Despite Delaware’s exposure to coastal storms and hurricanes, its strong grid is due to the state’s small size, responsive crews, and well-maintained grid system. Massachusetts is right behind Delaware with an average outage time of 102 minutes.
Since the war started in Ukraine, there have been reductions
in Russian gas supplies and to address this issue, the countries of European
Union had set a goal of reducing their natural gas consumption by 15 percent
between August 2022 and March 2023 compared to the average of the past five
years. In December, Eurostat announced that the EU is on track with that goal,
with gas consumption in the EU-27 falling by about 20 percent over the
August-November period (compared to the 2017-2021 average).
For years, hydropower, coal and gas have been the primary
sources of producing energy worldwide. Countries have now started to adopt the
newer methods using intermittent sources of power like solar and wind. Due to
these sources, the need of energy storage has increased especially because now
grid-scale power dams, coal, natural gas and nuclear is not the source. These
sources are quite useful but there are challenges like during the night and
when weather is cloudy or there is no wind blowing. Due to these challenges
energy stored in the energy storages will have to be utilized in order to run
communities, businesses and hospitals.
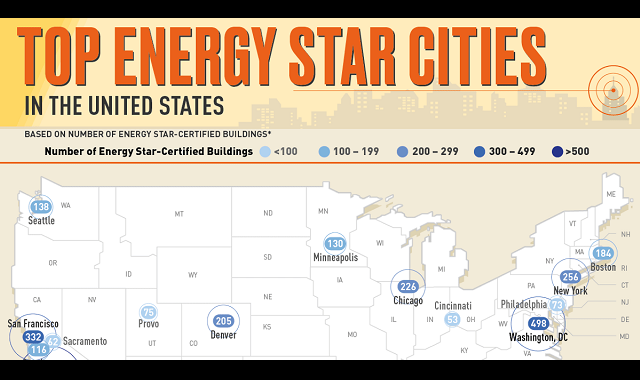
Do you live in a city that values the importance of lessening their carbon footprint? Some of the most energy efficient cities contain the most Energy Star certified buildings. These buildings have lower utility bills which leads to a large profit margin. These buildings are certified every year and use about 35% less energy than other buildings around the same size around the US.
This infographic shows the increase in solar panel efficiency over time and it is fascinating to see how far we have come in this world in creating solar power. Green energy and renewable energy is great for the environment, and there are hundreds of thousands of uses for solar power across the globe. More and more households are adding solar panels to their rooftops as energy prices soar.
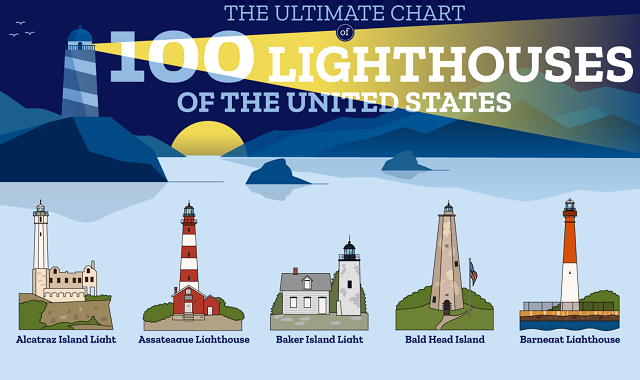
Lighthouses have been beacons of maritime navigation for centuries. They serve a very important part in making sure boats and other marine vessels stay safe and navigate where they need to go. There are many historic lighthouses around the United States that have provided guidance for boats throughout the years.
There are many ways to generate power and some are better for the environment than others. Wind, water and solar energy don't create harmful emissions like coal or nuclear power plants. In the US, the Biden administration wants a completely carbon pollution-free power sector by 2035 and they want to extend that to zero emissions economy-wide by 2050.
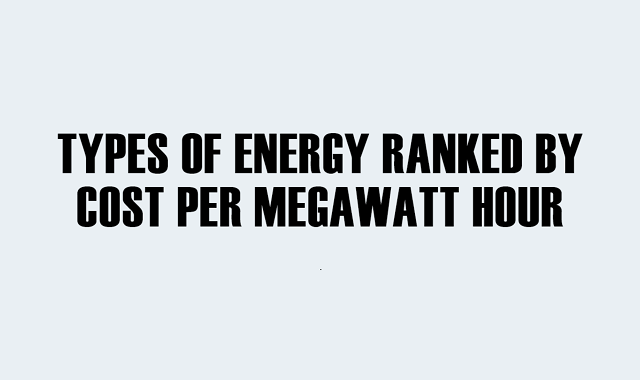
Renewable energy is the future of the energy industry, and the U.S. Energy Information Administration has projected that by 2050, 45% of global energy generation will be through the use of renewables. There are a variety of different renewable energy sources to use, each with their own pros and cons. One con of some of these systems is the high price tag, but other options are much more affordable.


