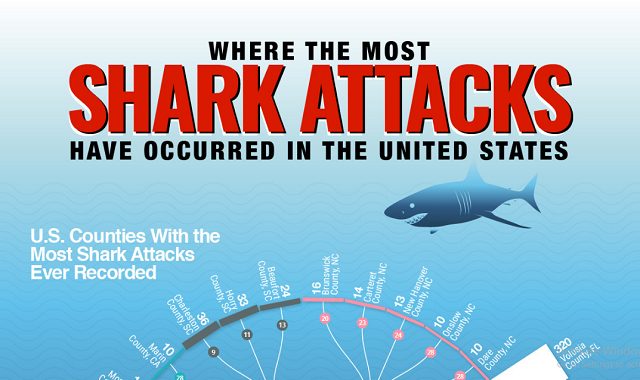

What makes a fear of the ocean so intense for some people? Thalassophobia, there is even a word for it, quite literally means 'Ocean Fear'. Maybe it stems from thoughts of the unknown, what could possibly be below you lurking in the depths waiting to attack? Although the oceans are filled with a wide variety of terrifying creatures and monster size sharks there is really no need to be afraid of enjoying a nice swim in the ocean. You have a greater chance of being killed by lightning than you do a shark. If being attacked by a a shark while swimming is a source of anxiety or fear for you, maybe this graph can help. Reading up on attack statistics around the US from 2011 - 2020 the team at SI yachts put together this awesome donut chart that shows which county a shark attack has occurred in over the time period. You can also see how only a fraction of these attacks ended fatally. All of these attacks have either been by a Great White or a Tiger Shark. The 10 U.S. counties with the most shark attacks ever recorded are as follows:
Volusia County, FL: 320
Brevard County, FL: 153
Palm Beach County, FL: 80
Maui County, HI: 69
Duval County, FL: 46
St. Johns County, FL: 44
Oahu County, HI: 42
Martin County, FL: 39
Charleston County, SC: 36
St. Lucie County, FL: 35

Infographic by: siyachts
