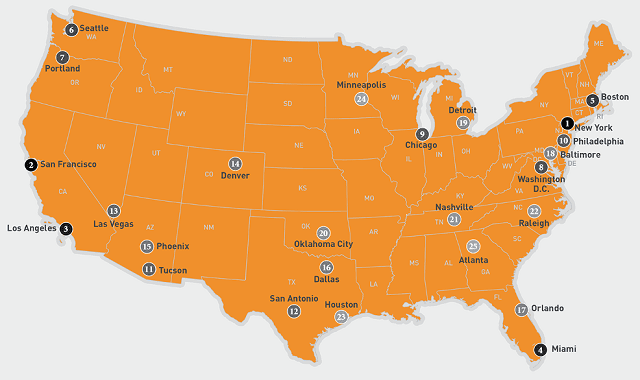
Big cities often mean small spaces to call home. The “Broom Closet Index” was created by HomeAdvisor.com to determine where you are most likely to live in a cramped space out of 25 major U.S. cities. To calculate the index, Home Advisor collected and analyzed data from the United States Census Bureau and the Council for Community and Economic Research was used.
This data includes median square foot of housing space per person, median housing unit size (combined house and apartment), median monthly housing costs, median household income, and cost of living. New York City has the highest “Broom Closet Index” due to the extremely high cost of living, the average 575 square foot per person, and the relatively high median yearly housing costs. San Francisco offers only slightly more space overall, but the median housing costs are the highest. Atlanta, Georgia has the lowest “Broom Closet Index”, with some of the lowest annual housing costs. Many describe Atlanta as a sprawling, green city, so this makes sense.
Despite the small quarters and high costs, many still flock to these cities in pursuit of their futures, happiness, and dreams.

Infographic by: www.homeadvisor.com
This data includes median square foot of housing space per person, median housing unit size (combined house and apartment), median monthly housing costs, median household income, and cost of living. New York City has the highest “Broom Closet Index” due to the extremely high cost of living, the average 575 square foot per person, and the relatively high median yearly housing costs. San Francisco offers only slightly more space overall, but the median housing costs are the highest. Atlanta, Georgia has the lowest “Broom Closet Index”, with some of the lowest annual housing costs. Many describe Atlanta as a sprawling, green city, so this makes sense.
Despite the small quarters and high costs, many still flock to these cities in pursuit of their futures, happiness, and dreams.

Infographic by: www.homeadvisor.com

