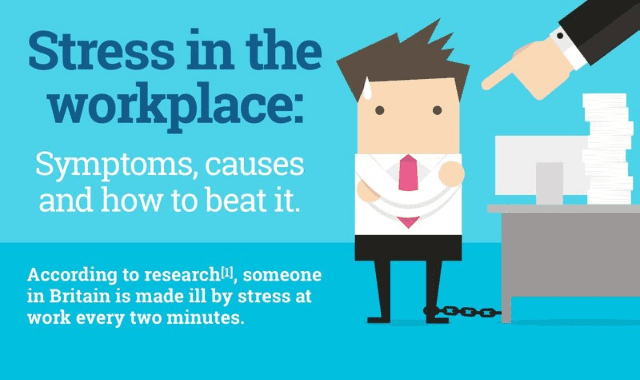
Shepherds Friendly have created an infographic in the hope to encourage employers to think more about the wellbeing of their staff as many people suffering from stress, often suffer in silence.
Someone is made ill by stress at work every two minutes, which highlights the importance of being aware of the symptoms, causes and how to beat it.
The Health and Safety Executive (HSE) claimed that in 2015/16, 488,000 people in the UK reported work-related stress at a level they believed was making them ill. This accounted for 37% of all work related ill health cases!
Research has found that the average person spends about 90,000 hours at work over their lifetime. That is a lot of our lifetime hours spent doing a 9-5 so isn't it vital that we pay attention to our health at work?
It is important we find ways to beat workplace stress in order to lead happier and more fulfilling lives.

Infographic by: www.shepherdsfriendly.co.uk
Someone is made ill by stress at work every two minutes, which highlights the importance of being aware of the symptoms, causes and how to beat it.
The Health and Safety Executive (HSE) claimed that in 2015/16, 488,000 people in the UK reported work-related stress at a level they believed was making them ill. This accounted for 37% of all work related ill health cases!
Research has found that the average person spends about 90,000 hours at work over their lifetime. That is a lot of our lifetime hours spent doing a 9-5 so isn't it vital that we pay attention to our health at work?
It is important we find ways to beat workplace stress in order to lead happier and more fulfilling lives.
Infographic by: www.shepherdsfriendly.co.uk

