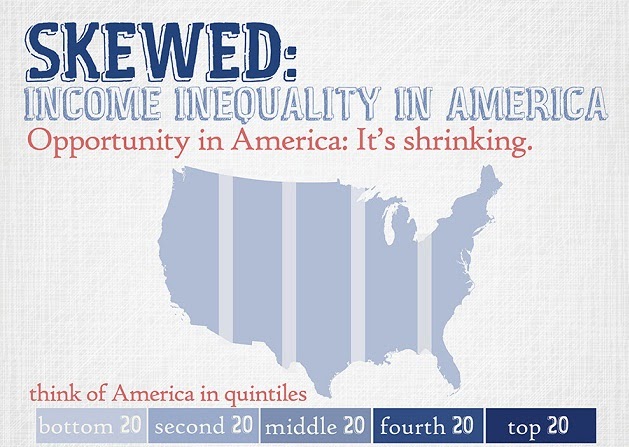
Opportunity in America: It’s shrinking.
Lowest 60% of earners are making less than the wealthiest 400 Americans:
$1.22 trillion vs. $1.27 trillion.
 Infographic by: financedegreecenter.com
Opportunity in America: It’s shrinking.
Lowest 60% of earners are making less than the wealthiest 400 Americans:
$1.22 trillion vs. $1.27 trillion.
 Infographic by: financedegreecenter.com
Skewed: Income Inequality In America [infographic]
Load comments
Disqus Codes
- To write a bold letter please use
<strong></strong>or<b></b> - To write a italic letter please use
<em></em>or<i></i> - To write a underline letter please use
<u></u> - To write a strikethrought letter please use
<strike></strike> - To write HTML code, please use
<code></code>or<pre></pre>or<pre><code></code></pre>
And use parse tool below to easy get the style.
strong em u strike
pre code pre code spoiler
embed

