June 2014 - Visualistan -->

    Social Items

Image: How to Measure ROI in Social Media #infographic
To show you how you can track the return on investment of your social media campaigns and use that knowledge to maximize your ROI, quicksprout has created an infographic that breaks down the steps you need to take to achieve these goals.

How to Measure ROI in Social Media #infographic

Image: Things you should Know about Gmail #infographic
Gmail launched on April 1, 2004 (that's 10 year ago!) as invite-only beta, with 1 GB storage (that's 20x more than the standard for email providers), threaded conversations, and more.

Things you should Know about Gmail #infographic

Image: Why Private Browsing Doesn't Exist #infographic
Digital fingerprinting occurs when the website you visit piece together information about your browser and previous sites you've visited. The information is valuable to advertisers. This tactic has been around since at least 2009, and collects a variety of information about you and your computer.

Why Private Browsing Doesn't Exist #infographic

Image: The Mobile Web: Will it Replace Desktop Use? #infographic
7 Billion Total Population. 2.33 Billion Peoples Are Internet Users. 1.2 Billion Peoples Are Mobile Internet Users. 5.9 Billion Out of 7 Billion People Worldwide Are mobile Users. 17% Use mobile Web a Total of 1.2 Billion Mobile Web Users World Wide. 30% of the world Mobile Users Live in china (963 Million) And in India (844 Million). 680 MILLION Out of 1.6 Billion Monthly Active User Face book On Mobile. 82.5 MILLION Out of 165 Million Users Use Twitter On Mobile. 200 MILLION+ Videos Watched On Mobile Devices Each Day.

The Mobile Web: Will it Replace Desktop Use? #infographic

Image: 10-Step Checklist to Build & Market a Successful App #infographic
10-Step Checklist to Build and Market a Successful App details the necessary course of action – step-by-step from app concept to launch – to help apps reach their full potential. Serving as a business model for developers and creative hopefuls, the infographic is composed of foundational notes and operational checkpoints as well as tips for general success.

10-Step Checklist to Build & Market a Successful App #infographic

Image: What Does It Take To Get A Job At Google? #infographic
Being one of the largest companies to date, it is no surprise that everyone wants to work at Google. The benefits that Google gives its employees exceed satisfaction level. There are free food, sleeping pods, playgrounds, a comfortable working environment and a really good salary. In addition to that, employees also get free medical and dental checkups, free haircut, free laundry and many more. What more could you ask for? It's the dream job for most of us.  However, getting a job at Google is not as easy as it seems. Each year, they get around 2 million applicants. That means there also has to be some form of rigorous and careful hiring process.  Check out this infographic from Staff.com. Here are some of what Google looks out for when they are hiring people.

What Does It Take To Get A Job At Google? #infographic

Image: Navigating the Global Digital Ad Landscape #infographic
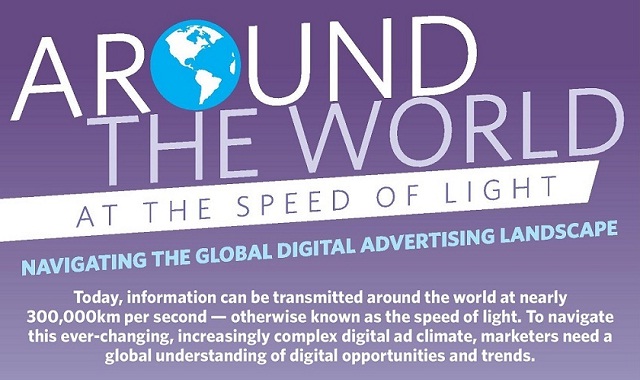
If your’re marketing on social, you’ll want to know which countries use social channels like Facebook and YouTube the most. How much money do consumers in France and Spain spend via mobile? What percentage of ad budget do marketers in China spend on banner ads, keyword search, or video? How should you market differently to audiences in the US, versus those in Canada? Check out our new infographic to get started with global digital marketing today.

Navigating the Global Digital Ad Landscape #infographic

Image: Employment Trends in Mining #infographic
Did you know women make up only 16% of the mining workforce in Canada? Or that 1 in 3 are expected to retire by 2022? We reviewed some of the top employment trends happening in the mining industry. We found what factors are driving workforce changes and what factors are discouraging entry into the industry. See where the talent gap is and the projected hiring requirements in the next decade of mining!

Employment Trends in Mining #infographic

Image: Stop The Stigma : The Realities Of Mental Health #infographic
Many people do net seek treatment for their mental health issues because of the "mark" which comes from the judgment of others. This "mark", often referred to as stigma, causes people embarrassment and shame; simply for wanting to better themselves.

Stop The Stigma : The Realities Of Mental Health #infographic

Image: Emerging Medical Professions #infographic
Healthcare jobs are expected to grow faster than any other industry. In fact, it is expected that 3.2 million new jobs become available by 2018. What’s more is that throughout 2014, wages and salaries will rise by approximately 27%.

Emerging Medical Professions #infographic

Image: The Evolution of Women's Sport Apparel #infographic
A "then" and "now" comparison of soccer, softball, volleyball, basketball, golf, tennis, swimming, track and field, and hockey apparel.

The Evolution of Women's Sport Apparel #infographic

Image: How People React To Failure #infographic
Some people wallow, some take it really personally. Others choose to process it, learn, get inspired eventually and even get the expert's opinion. The many ways people react to failure, we choose it and it can play a vital role on our success.

How People React To Failure #infographic

Image: United States vs. Germany #infographic
USA advances after losing to Germany 1-01 thanks to our new BFFs. Portugal. We may not have won the game, but we are the clear winners when it comes to some of the following.

United States vs. Germany #infographic

Image: Find Your Path to Fitness #infographic
Working out is something that can be fun, motivating, and challenging. The challenge part is what gets people going. So before you start, there are a few questions that you will need answers for. You need to identify what you want your end-game to be after you are well into your regimen. Are you wanting to look more fit, or are you trying to be more fit and healthy?

Find Your Path to Fitness #infographic

Image: Beach Body Tips and Tricks #infographic
Looking great in a bikini does not have to be torturous. In fact, if you are willing to watch what you eat and try out a few tips and tricks, you can have a bikini-worthy body before you know it.

Beach Body Tips and Tricks #infographic

Image: The Power of Color #infographic
Color matters when defining a brand. This infographic created by dezinegirl creative studio is a helpful guide to making the right choice.

The Power of Color #infographic

Image: What Do People Read on the Toilet? #infographic
People spend an average of 30 minutes in the bathroom every day. Most of us love to read on the toilet besides simply answering nature’s call. Check out this infographic and see what exactly everyone is reading and what health risk it might cause!

What Do People Read on the Toilet? #infographic

Image: Inside the Mind of a Child #infographic
While we all seek to be young at heart, children's brains are actually far different from that of an adult's. You'll see the progression in this infographic.

Inside the Mind of a Child #infographic

Image: Game of World Cup: Player Similarities #infographic
We search and found which World Cup players have similarities with Game of Thrones characters. Check below and let us know what do you think. Feel free to comment which other similarities exist between other players and characters of Game of Thrones.

Game of World Cup: Player Similarities #infographic

Image: A History of the Pound #infographic
A history of the pound, the oldest currency still in use in the United Kingdom.

A History of the Pound #infographic

Image: Brewing Up the Best Content #infographic
Good beer and great content have a lot in common. They're both fresh, fun to share, and leave your customers smiling. So how do you brew the best content? Follow the steps in below infographic, to become a master of the craft.

Brewing Up the Best Content #infographic

Image: How to Increase Sales by 10 Percent #infographic
On average, one of your sales representatives will invest nearly half of their time practicing for upcoming meetings or presentations. Of course some preparation is necessary, but if you had more sales enablement- more time with a sales rep in front of a promising client- you would no doubt have more sales. Yes, practicing for hours a day may lead to a perfect pitch but that doesn't mean much if there is no sales enablement. With sales automation, sales enablement- face-to-face time with prospects- increases up to an average of 10 percent. Alone, that may not seem like much, but across an entire team, or a given span of time, a 10 percent increase in sales enablement leads to a much more efficient and profitable environment.

How to Increase Sales by 10 Percent #infographic

Image: Making the Grade: Why Classroom Movement Gets an A+ #infographic
Despite strong evidence supporting the positive connection between learning and movement, pressure to improve test scores and reduced budgets continue to spur educators to forgo recess and physical education to reallocate more time in the classroom. Research shows that reducing opportunities for physical activity in school limits a student's ability to learn.

Making the Grade: Why Classroom Movement Gets an A+ #infographic

Image: World Cup 2014 Health Rankings #infographic
Countries that spend more on health care often also have a higher life expectancy, though many other factors can contribute to variations across countries. This infographic shows health care spending and life expectancy (PNG) for countries competing in the 2014 World Cup Group of 16 to see how these two health indicators played out.

World Cup 2014 Health Rankings #infographic

Image: Wedding Budget: Saving Money #infographic
How to save on every aspect of your wedding including the dress, the venue, the decor, the flowers, the food, and the drink!

Wedding Budget: Saving Money #infographic

Image: Welcome To The New World Of Ecommerce #infographic
With technology moving on at this speed, more and more of information practices is emerging, quite apparently. An important establishment of technology in this respect is the online shopping – which is also known as e-shopping or e-commerce. Since its inception, ecommerce has changed the way services and products were advertised and bought. People who started early made it big and continued to explore more opportunities, and cruised towards improved scenario of ecommerce.

There was a time when a small number of websites used to offer population with the E-commerce facilities. These website earned massive returns and claimed their purple patch right then but with time the contest raised geometrically. Quite obviously, a point is reached where it has turned difficult to develop and market an online store that stands competition well.

This infographic, brought to you by vebology, highlights some of the key aspects and trends of this new world of ecommerce. The new decade of ecommerce is more competitive.

Welcome To The New World Of Ecommerce #infographic

Image: 2014 Marketing World Cup #infographic
The 2014 World Cup will be one of the most talked-about sporting events in history, providing marketers with an unprecedented opportunity for global brand engagement.

2014 Marketing World Cup #infographic

Image: Posting Power: Tracking Your Social Media Data #infographic
So your business is on Facebook and Twitter; maybe you even have a blog in order to keep in touch with your customers. But just having social media profiles isn't always enough. Like any business practice, gauging how effective it is remains essential to success. Let's take a look at some tools you can use to measure how effective and engaging your social media presence truly is.

Posting Power: Tracking Your Social Media Data #infographic

Image: A Quick Guide to FCC Corruption #infographic
The Federal Communications Commission is currently seeking to introduce a new rule that allows Internet Service Providers, such as Comcast, ATGT and Verizon, to charge content providers for faster delivery of their content. Such a measure would benefit ISPs tremendously, many of which operate their own content platforms, but would fly in the face of net neutrality, creating an uneven playing field for smaller, independent, internet companies.

A Quick Guide to FCC Corruption #infographic

Image: World Aviation #infographic
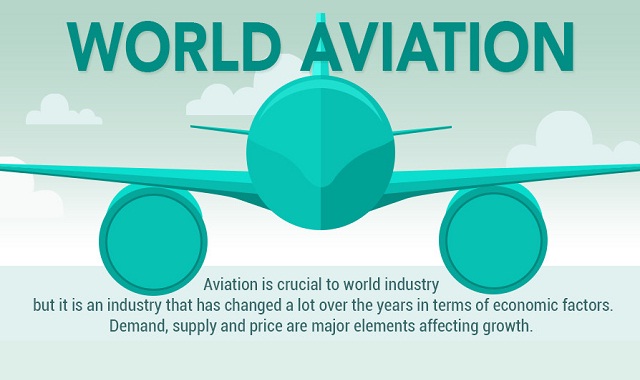
The Infographic is about world aviation and its increasing traffic. Did you know for example, that by 2024, global air traffic is likely to reach an astounding 1 billion? This and many other interesting facts are listed in this infographic.

World Aviation #infographic

Image: 5 Myths About the Criminal Justice Field #infographic
If crime shows have taught us anything, the criminal justice system is all about brilliant serial killers, high-speed pursuits, instant lab results, and quickly resolved cases. We've compiled a list of a few common myths about working in the criminal justice field.

5 Myths About the Criminal Justice Field #infographic

Image: 25 of the Best Museums and Galleries in London #infographic
There's a wealth of cultural destinations to explore in the capital, and many of them are absolutely free. So, next time you're after a family day out in London - why not wander about ancient ruins, see portraits of medieval royalty, or take part in a hands-on art workshop?

25 of the Best Museums and Galleries in London #infographic

Image: How to Start a Web Design Project
The infographic below outlines every stage of the web design process from start to finish. Congratulations on landing your first web design project! By now you've probably figured out that creating a website that's both visually appealing and pleasing to your client is no easy task. Here's everything you need to know to get started.

How to Start a Web Design Project #infographic

Image: Back Pain and Everyday Activity #infographic
This infographic covers the subject of back pain from the point of view of it and our everyday activities. It covers some broad facts about the injury and also gives some tips on how to prevent back issues happening in the first place.

Back Pain and Everyday Activity #infographic

Image: Maya Angelou #infographic
Maya Angelou or Marguerite Annie Johnson was a famous poet, author, singer and dancer. She was born on April 4th, 1928 in San Francisco and died on May 28th 2014. Her life has been told in seven autobiographies with the first one called I Know Why the Caged Bird Sings. While her last autobiography Mom and Me and Mom was published when she was eighty five years old.

Maya Angelou #infographic

Image: Rush to Flush #infographic
Did you know 45% of British sports fans will rush to the toilet during a break in play during big sporting events? See how our nations rush to flush impacts our nation's draining systems which include the huge crisis of blocked drains.

Rush to Flush #infographic

Image: Launch a Tech Startup in 5 Steps #infographic
This infographic shows how you can start a tech business in 5 steps. Learn what you’ll need to do to launch a startup today.

Launch a Tech Startup in 5 Steps #infographic

Image: How to Generate Leads with Social Media #infographic
You’re already on social sites like Facebook and Twitter, but are you generating traffic from them? And, more importantly, are you generating leads? How do you generate leads from the social web? In order to show you the steps you need to take, quicksprout has created an infographic that will break down the whole process.

How to Generate Leads with Social Media #infographic

Image: What Will the Internet Look Like in 100 Years? #infographic
Wearable technology and augmented reality are coming to a year near you. Bitcoin and other crypto-currencies are tipping into the mainstream. Internet-giving balloons and delivery drones will soon be battling for air space. Dog translation hardware is close to reality. In the following graphic whoishostingthis illustrate the (possible) future of technology. What will the internet look like in the near future, 20 years, 100 years?

What Will the Internet Look Like in 100 Years? #infographic

Image: Selfie Boom: The Good, The Bad, and the Ugly #infographic
"Let me take a selfie." If you've heard that song and wondered where the selfie boom started? Here's the good, the bad, and the ugly when it comes to a selfie.

Selfie Boom: The Good, The Bad, and the Ugly #infographic

Image: 8 Emerging Tech Trends You Can't Ignore! #infographic
Modern technology if filled with all sorts of helpful and entertaining finds! Check out the 8 emerging trends that come with technology in mobile phones, the cloud and more- these, you can't ignore.

8 Emerging Tech Trends You Can't Ignore! #infographic

Image: 4th of July - The Day of Glory #infographic
Family traditions and customs, fireworks, patriotic movies and songs, parades, cookouts, not to mention red, white and blue - things Americans closely associate with 4th of July have been surprisingly constant since the country's founding in 1776.

4th of July - The Day of Glory #infographic

Image: How Makeup Changes Perception #infographic
We sought to find out how different styles of makeup affect perception. Check out the infographic.

How Makeup Changes Perception #infographic

Image: The Anatomy of an Enterprise Social Cyber Attack #infographic
When new technology becomes mainstream, it's sure to quickly attractive the cyber criminal Social media has become part of our every day lives, both personally and professionally. It has changes the way we communicate with our friendsm, family, colleagues and customers, and it also has become one of the fastest growing cyber attack vectors. Cyber criminals use social networks, including sites such as LinkedIn, Facebook, Twitter, Skype and VKontakte as mediums for launching targeted malware and phishing schemes.

The Anatomy of an Enterprise Social Cyber Attack #infographic

Image: How To Impress In An Interview #infographic
Interviews are a lengthy process that can cause a lot of stress if you aren't prepared. But if you are, then you have nothing to worry about. Take a look at these 10 interview tips to ensure that you impress and hopefully make the vacancy a job you can call your own!

How To Impress In An Interview #infographic

Image: World Cup Wonders #infographic
Soccer legend PelĂ© won a World Cup title with Brazil at the age of 17, then led the team to two more titles in later years. What other teams and players have stood out at the world’s favorite tournament? Find plenty of World Cup facts and trivia in this infographic.

World Cup Wonders #infographic

Image: How to Beat the Airport Layover Blues #infographic
Waiting around in airports is the hardest thing about travelling. When we are in transit all we want to do is arrive at our destination... but with flight cancellations and delays this can sometimes mean waiting around for hours on end! Lucky for you Corporate Traveller have developed this infographic with some helpful tips on how to beat the airport layover blues and make your waiting time fly! Bon Voyage!

How to Beat the Airport Layover Blues #infographic

Image: This will make you more attractive to girls if you read it #infographic
Whether we like to admit or not we all know that women hold the real power and wear the trousers. Women control the majority of all our purchasing decisions, from our cars to our computers so even if your product is aimed at the male market their is a good chance that it will need to appeal to women as well. So if they have so much power in our purchasing decisions how best is it to market to them? There are now so many marketing channels and messages that it is easy for your message to get lost in the huge amount of ‘Buy Me‘ marketing white noise. Without the big budgets it can be hard to stand out from the crowd and grab their attention but with mobile marketing you might just be able to.

This will make you more attractive to girls if you read it #infographic

Image: 10 Coolest International Borders #infographic
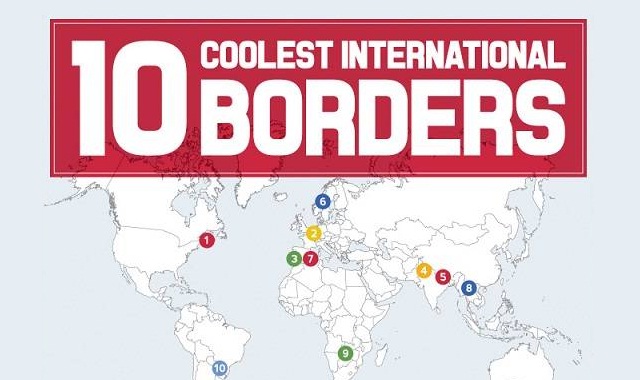
International borders can be fascinating places. Some are defined by natural features while others are simplyformed by lines of longitude or latitude. Whether you're crossing a river, mountain or through a good old-fashioned checkpoint - just make sure you remember your passport!

10 Coolest International Borders #infographic

Subscribe Our Newsletter

Notifications

Disqus Logo